
Note: This is the second article of the series: Cool Spark ML. The other parts can be found below:
- Part 1: K Nearest Neighbours
- Part 2: Preprocessing of Data (current)
People who have been performing Machine Learning for quite a long time know that Data Preprocessing is a key step before running any algorithms on the data. In a majority of datasets, you might always find null, or incomplete values. The data would also be inconsistent across columns, which directly affects algorithms using distance measures.
This is where Data Preprocessing comes in. It is a crucial step which involves cleaning and organizing the data to make it suitable for building models. In other words, if you don’t perform Preprocessing, your models may not be accurate.
While there are quite a lot of articles online about Data Preprocessing in Python, there aren’t a lot of them in Spark, or even Scala. In this post, I will be dealing with the ways you can perform Data Preprocessing in Spark on Scala.
PS. You might be asking why I’m dealing with this now when I have actually written KNN in Spark before. The truth is, KNN isn’t officially supported inside Spark ML module. What I wrote in the previous article was a top-to-bottom version of KNN performed using Spark. You can also say that I’m doing a complete reset of this series 😅
Just like always, the codes for all posts in this series will be available on my GitHub repo.
Types of Preprocessing in Spark
There are two types of preprocessing:
- Numeric Data
- Text Data
Numeric Data
There are three ways you can preprocess numeric data in Spark:
- Normalize
- Standardize
- Bucketize
To illustrate Normalize and Standardize, I’ll be using some Scala magic which will generate my points as a Vector. Each vector represents a point in a 3-Dimensional Space.
| |
Doing the above results in the following DataFrame:
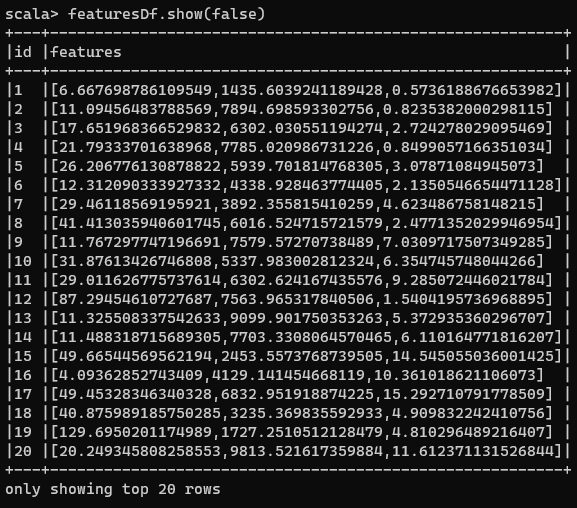
Each element inside Features column represents a point in a 3-D space.
Normalize
Normalization is the process of mapping numeric data from their original range into a range of 0 to 1. The lowest value of the original range gets value of 0, and the highest gets the value 1. All the other values in the original range will fall between these two.
This is important because there may be multiple attributes with different ranges. E.g. Salary values may range between 3 and 8+ digit numbers, years in company will be between 1- and 2-digit numbers. The reason we want to normalize those attributes in a [0,1] range is so that when algorithms that use distance as a measure, they don’t weigh some attributes like salary more heavily than others.
The formula to convert values in an un-normalized column to a normalized form is given by:
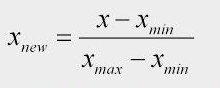
Normalization Formula
Where:
xis the value inside a column to be normalized,x(new)is the normalized value,x(min)is the minimum value of that column, andx(max)is the maximum value of that column
Working on the featuresDf created above, we will import MinMaxScaler from the org.apache.spark.ml.feature package. We now have to create an instance of the MinMaxScaler. It will take two parameters: Input column name, and an Output Column name. This object will transform the contents of the input column vectors into a scaled version, and save it into the output column.
In our case, we will be using our features column inside featuresDf as the input column, and our output column will be named sFeatures. We create the instance in this manner:
| |
Next, we have to fit the data present in our featuresDf inside this featureScaler and later transform to create the scaled data. This is done using the code below:
| |
Transforming original values into normalized ones
Now, if we have a look at our transformed data:
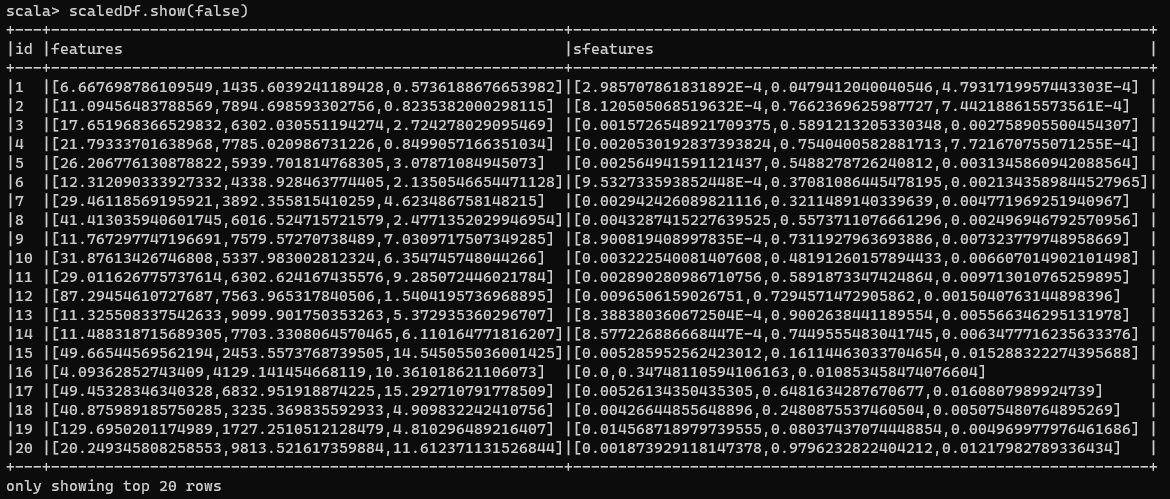
Normalized DataFrame
You can then use this new sFeatures to calculate distances among points.
Standardize
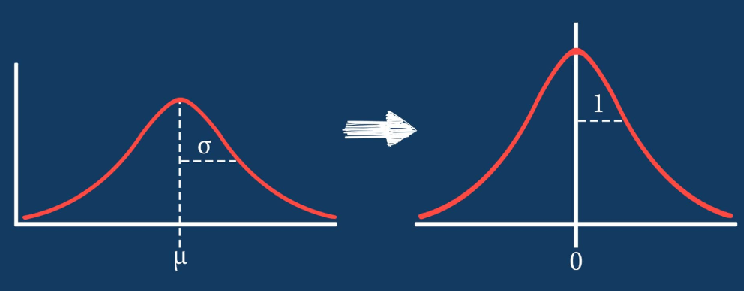
Now, we may have data whose values can be mapped to a bell-shaped curve, or normally distributed but maybe not exactly. With standardization, we map our data and transform it, which has a variance of 1 and/or a mean value of 0. This is done because some machine learning algorithms, like SVM, work better this way.
Thus, what happens is when we apply standardization, our data is slightly shifted in its shape so that it becomes more normalized, or more like a bell curve. The formula to convert values in a non-standardized column to a standardized form is given by:
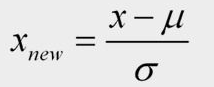
Standardization Formula
Where:
xis the value to be standardizedx(new)is the standardized valueμis the mean of the columnσis the standard deviation of the column.
Again, we will be using the featuresDf created above. We will import StandardScaler from the org.apache.spark.ml.feature package. Just like MinMaxScaler, an instance of StandardScaler will require an input column and an output column. In our case, we will still continue with features and sFeatures. We will then fit the data inside the scaler and later transform the data. I’ve combined both these steps into a single code snippet:
| |
Now if we have a look at our transformed data:
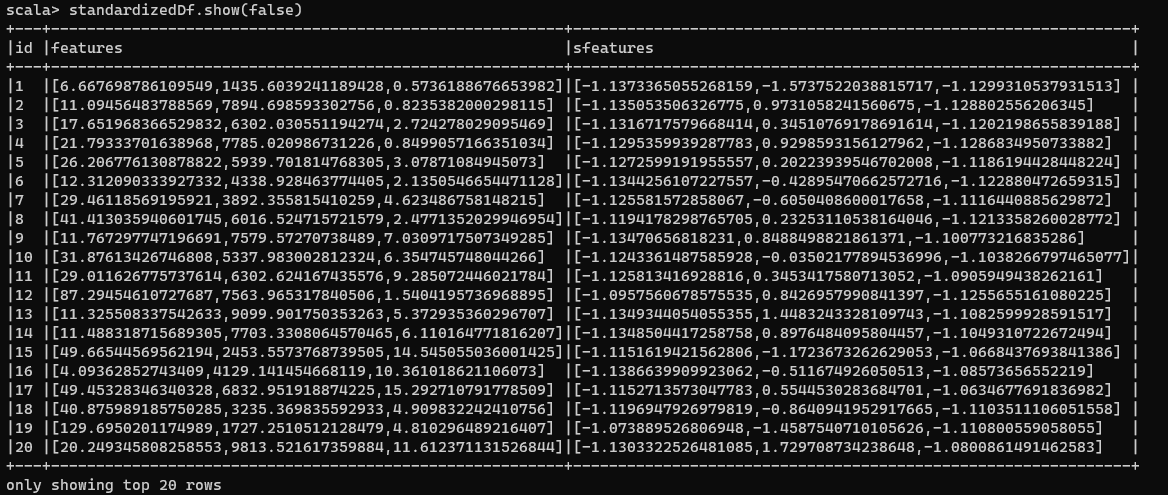
Standardized Numeric Data
Wait, weren’t the values supposed to be scaled within the range of [-1, 1]? Well, that’s the surprise associated with the StandardScaler. It uses the unbiased sample standard deviation instead of the population standard deviation.
In other words, while the standard deviation will be 1 (or very close to 1), the mean may not be necessarily 0. To scale your data in a way that the range of numbers is between [-1,1] and the standard deviation is 1 and mean 0, you will have to follow this accepted StackOverflow answer. Even otherwise with this process, the data has been standardized.
Bucketize
Bucketization is done when we have to organize continuous ranges of data into different buckets. Bucketizer allows us to group data based on boundaries, so a list of boundaries has to be provided. I will call it splits with the domain of all buckets when added looks like: {(-∞, -500.0) ⋃ [-500.0, -100.0) ⋃ [-100.0, -10.0) ⋃ [-10.0, 0.0) ⋃ [0.0, 10.0) ⋃ [10.0, 100.0) ⋃ [100.0, 500.0) ⋃ [500.0, ∞)}.
Then I’ll generate 1000 random points that fall in the range of [-10000.0, 10000.0] and save it in a DataFrame with column name as features. This is done using the below code:
| |
Now, our Bucketizer needs three inputs: the splits, input column name, and output column name. Then I’ll transform that data which would then give me the element and which bucket it belongs to:
| |
Notice that I didn’t have to do a fit operation before doing a transform. This is because Bucketizing is fairly simple and you only need to find which bucket a number belongs to. Thus, there are no operations like scaling which happened in the other 2 sections, and hence you don’t need to fit your data. Now if we have a look at the created DataFrame:
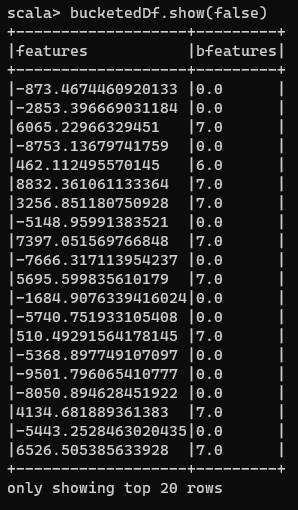
Bucketized DataFrame
Now you might also want to know how many numbers are there in a particular bucket. So, I will do a groupBy on bFeatures column and retrieve the count of occurrences. The following code does that and displays my generated data:
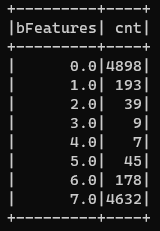
Fairly easy, isn’t it?
Text
There are two ways in which you can preprocess text-based data in Spark:
- Tokenize
- TF-IDF
To illustrate both of them, I will be using sentencesDf created using this code:
| |
Tokenize
In tokenization, you map your string containing a sentence into a set of tokens, or words. As an Example, the sentence “This is an introduction to Spark ML” can be mapped into a list of 7 words - {This, is, an, introduction, to, Spark, ML}.
We will first import Tokenizer from the org.apache.spark.ml.feature package. Now an instance of this will need two parameters - input column and output column. Our input will be sentence and the output will be words, because that is what the Tokenizer will produce. Then we will apply transform on the sentences above.
Now, just like bucketing, we are not fitting any data here. Tokenizer already knows its job - Split strings into the separate words. The above process is illustrated in the code below:
| |
Now, if we have a look at our data:
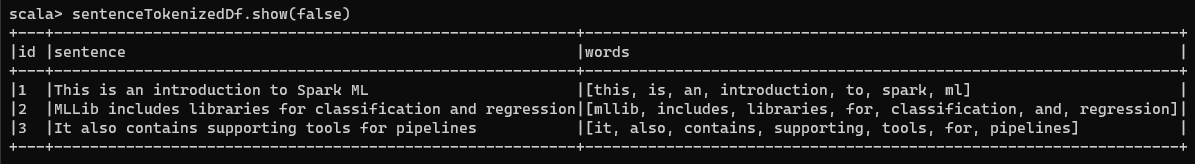
The words column contains lists of words that have been broken up in the ways you would expect a regular expression pattern matching to break up a sentence into words - based on white space, punctuation, etc.
Easy, isn’t it?
Term Frequency-Inverse Document Frequency (TF-IDF)
Here we map text from a single, typically long string, to a vector, indicating the frequency of each word in a text relative to a group of texts such as a corpus. This transformation is widely used in text classification.
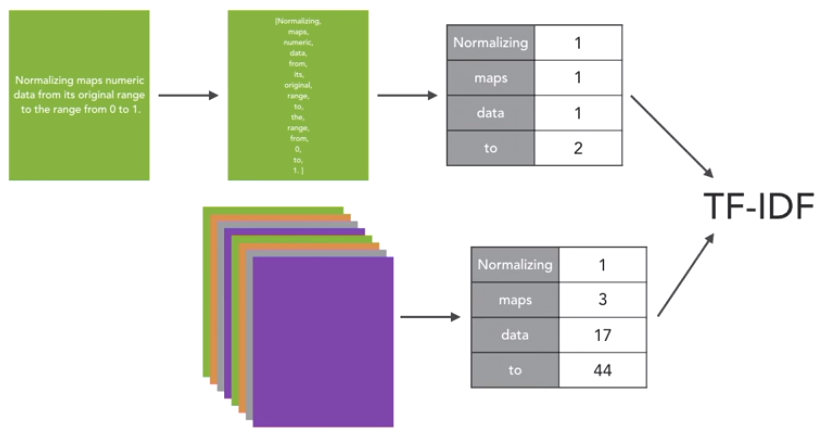
TF-IDF captures the intuition that infrequently used words are more useful for distinguishing categories of text than frequently used words. Considering the above figure as an example, Normalizing appears only once, to appears twice and so on. Like this, we go through all the documents in our corpus, which is nothing but a collection of documents. Then we count up how often a term appears across all of the documents. In this example normalizing is a very rare word. Whereas other words like maps, data and to show up more frequently. We use these two sets of counts and feed those two into the term frequency-inverse document frequency calculation. And that gives us our TF-IDF measures.
I will use the same sentenceTokenizedDf created above for this exercise as well. Just like other processes mentioned above, we will need to import a few things from org.apache.spark.ml.feature package - HashingTF (for hashing Term Frequency), IDF (for Inverse Document Frequency), Tokenizer.
First, I will create a HashingTF instance - which takes an input column (words), an output column (rawFeatures) and the number of features to keep track of (20) as the parameters. Now we apply our transformation on this and get a new DataFrame:
| |
Now if we have a look at our data, it has added an extra column which is of Vector type. It has mapped each word to an index, so for example, this maps to 1, is maps to 4, an -> 5, and so on.

Now we’re going to scale the rawFeatures vector values and we’re going to scale them based on how often the words appear in the entire collection of sentences. To do this we’re going to create an IDF instance. Again, we have to specify an input column (rawFeatures) and an output column (idfFeatures) as parameters.
Let’s use the term frequency data we just calculated to fit the inverse document frequency model. And to do that I’m going to create an idfModel, and we’re going to call the idf object I just created, and I’m going to fit it using our term frequency data. Then we apply the IDF transformation to create a new DataFrame that has both the term frequency and the inverse document frequency transformations applied.
| |
Now if we have a look at our data (I’m selecting only the rawFeatures and idfFeatures columns to fit in the screen):

Now we have a new column which contains the inverse document frequency features. These are measures of each word relative to how frequently they occur in the entire corpus. In our case our corpus is just three sentences.
CONCLUSION
Preprocessing is indeed a tough challenge where you will have to know what kinds of data you might get and what kinds of processing you want to apply on your data. If not done properly, your machine learning models might not be of much use.